Homogeneous Spheres
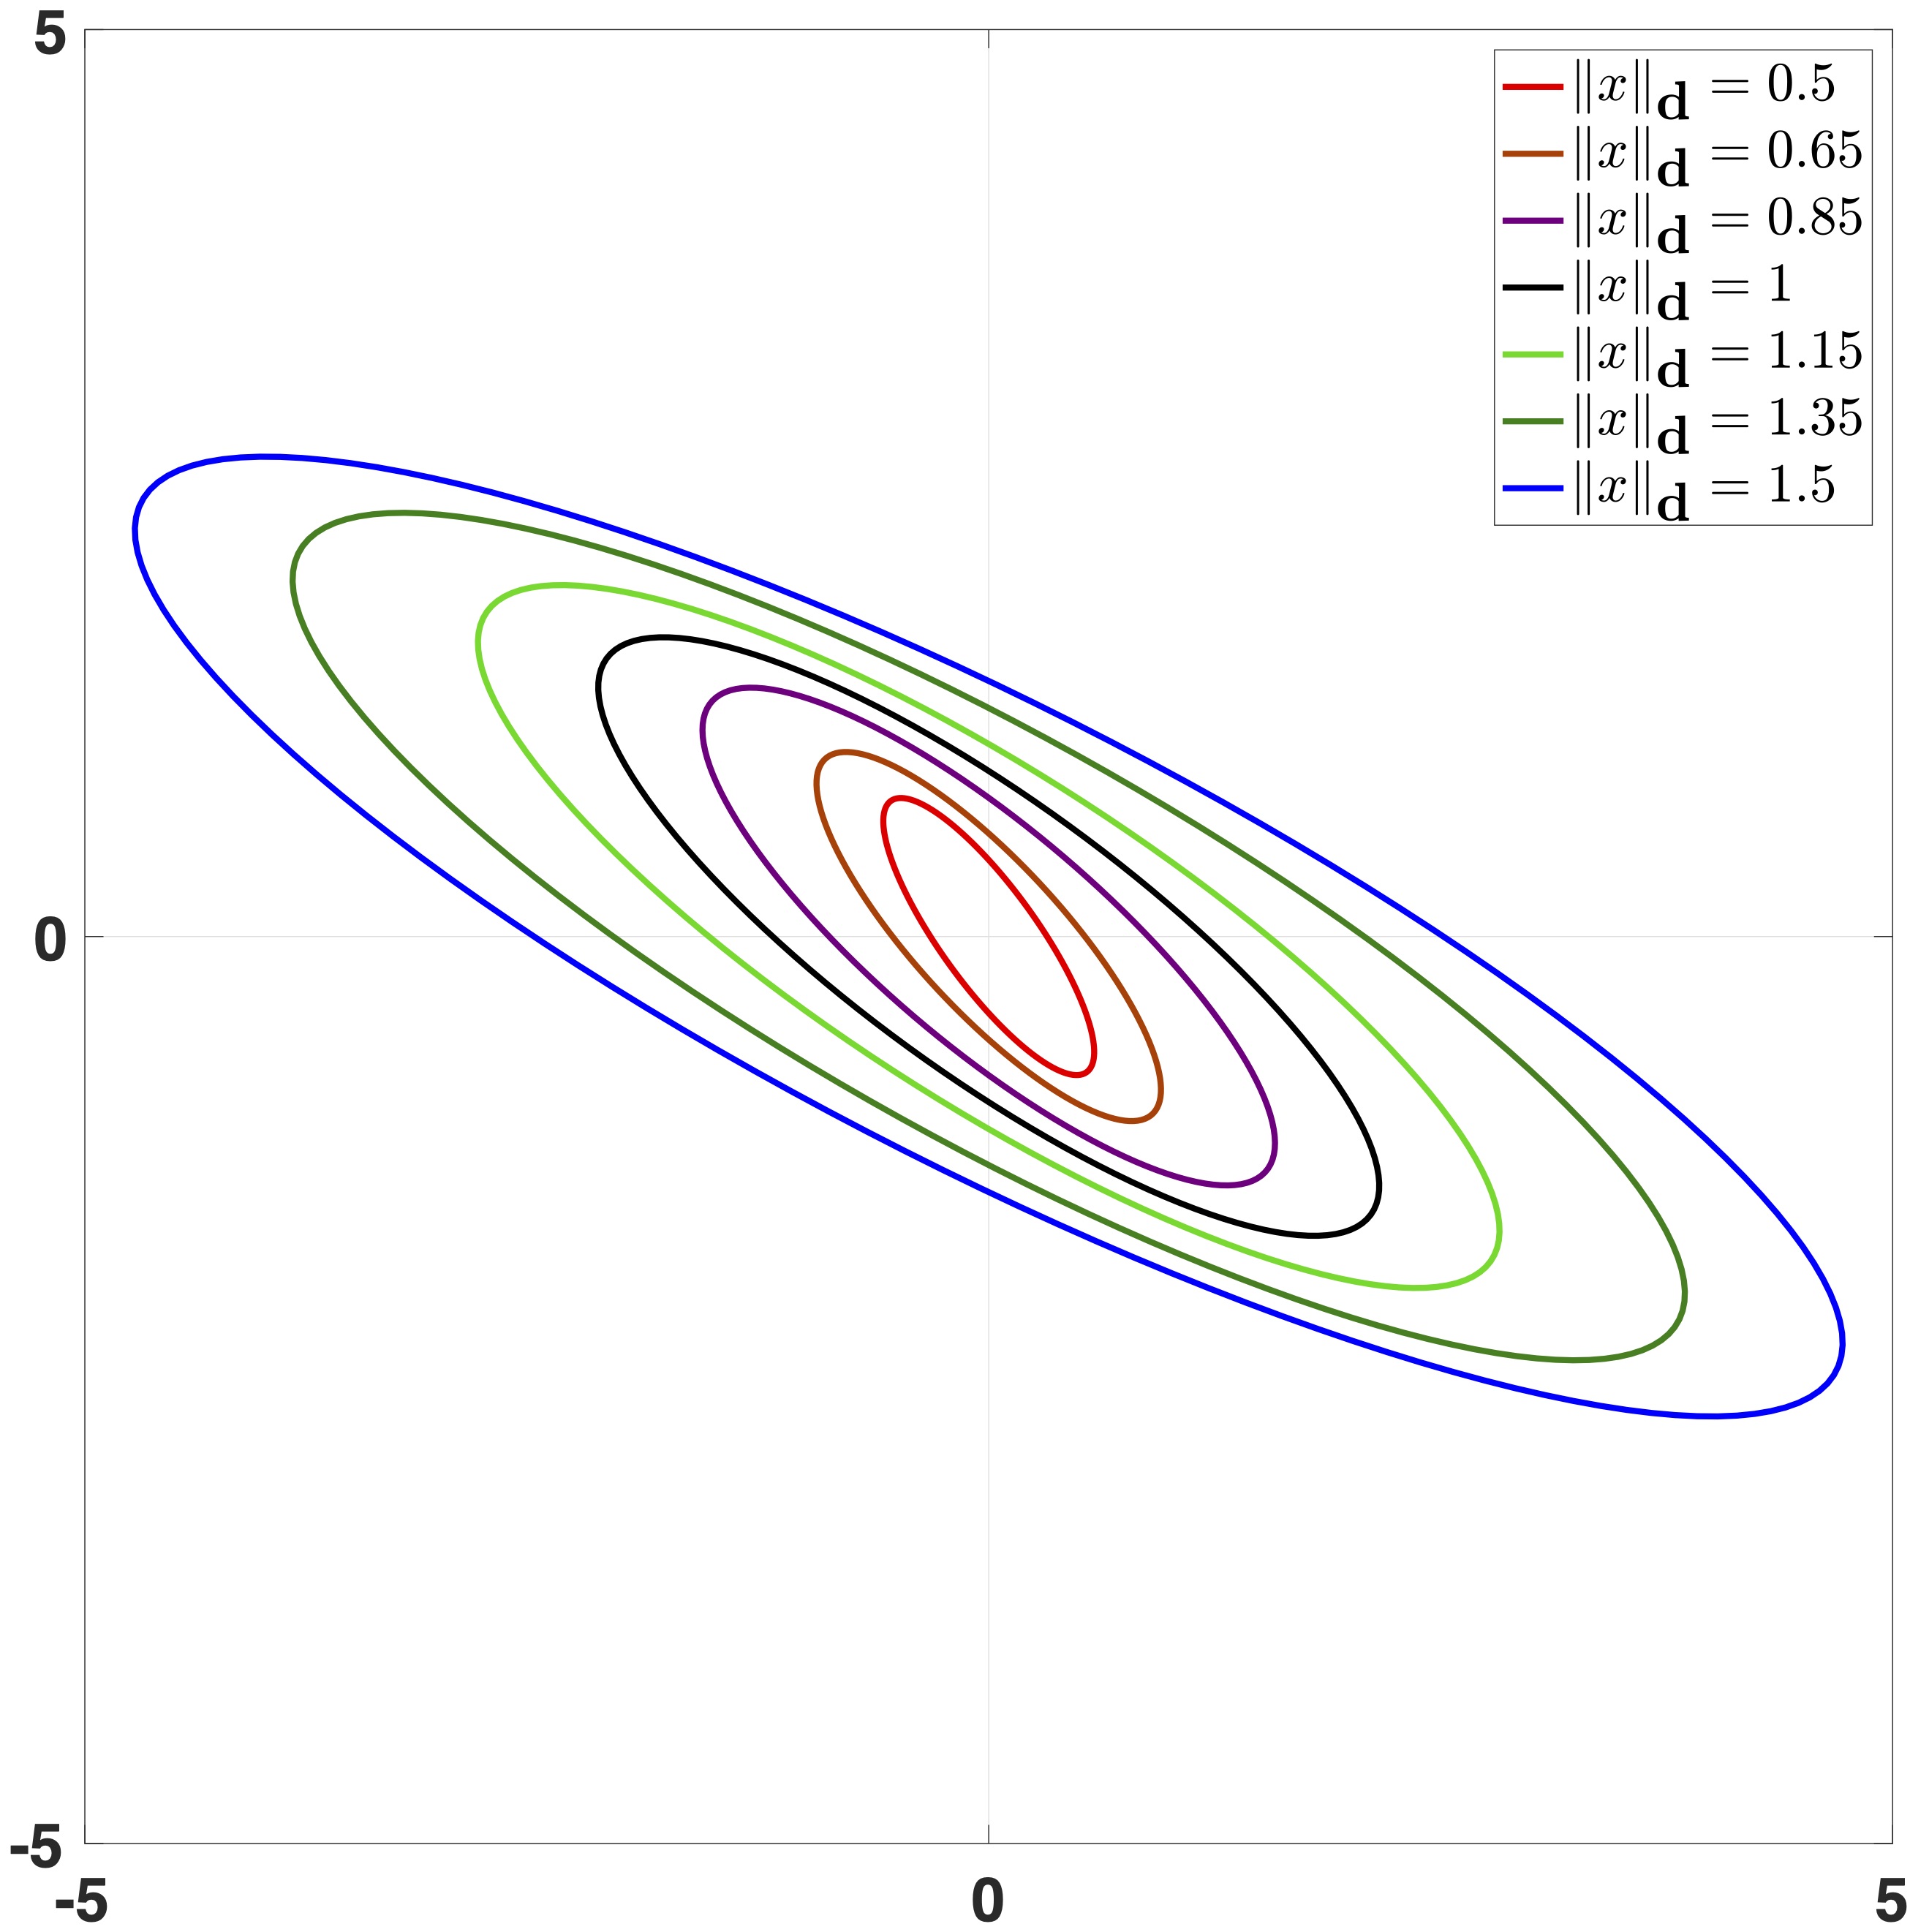
The set$S_{\mathbf{ d } }({\color{blue}r})=\left\{ z\in \mathbb{ R } ^n: \|z\|_{\mathbf{ d } }={\color{blue}r}\right\}, $
is a $\mathbf{ d } $-$\textbf{homogeneous sphere}$ of the radius $r>0$, where the dilation $\mathbf{ d } (s)=e^{s{\color{blue}G_{\mathbf{ d } }}}$ is a dilation monotone with respect to the norm $\|z\|=\sqrt{z^{\top}Pz}$ and $\|\cdot\|_{\mathbf{ d } }$ is the canonical homogeneous norm induced by $\|\cdot\|$.
Design of a homogeneous sphere
The function ${\color{red} { \texttt{hsphere}} } $ generates an array of points on a homogeneous sphere of the radius $r$.
- $\textbf{Input parameters}: {\color{blue}r}, {\color{blue}{G_{\mathbf{ d } }}}, {\color{blue}P} $ and $N_{\max}$ (number of points to be randomly generated on the sphere)
- $\textbf{Output parameters}: {\color{magenta}M} $(array of points on the sphere $S_{\mathbf{ d } }(r)$)
${\color{red} { \texttt{demo_hsphere.m}} } $
%%%%%%%%%%%%%%%%%%%%%%%%%%%%%%%%%%%%%%%%%%%%%%%%%%%%%%%%%%%%%%%%%%%%%%%%%%% %% %% Plot of homogeneous sphere %% %%%%%%%%%%%%%%%%%%%%%%%%%%%%%%%%%%%%%%%%%%%%%%%%%%%%%%%%%%%%%%%%%%%%%%%%%%% tol=1e-6; % compuational tolerance P=[1 -1; -1 2]; % the shape matrix of the wighted Euclidean norm if norm(P-P')>tol disp('Error: shape matrix P must be symmetric'); return; end; if min(real(eig(P)))<tol disp('Error: shape matrix P must be positive definite'); return; end; Gd=[2 0; 0 1]; % a dilation in R^2 %monotonicy check if min(real(eig(P*Gd+Gd'*P)))<tol disp('Error: dilation must be monotone'); return; end; %plotting homgoeneous spheres figure1 = figure; axes1 = axes('Parent',figure1); hold(axes1,'on'); K=5; %number of spheres to plot N=5000; %number of points on the sphere for i=1:K M=hsphere(i/3,Gd,P,N); color=rand(1,3); plot(M(1,:),M(2,:),'MarkerFaceColor',color,'Marker','o','LineStyle','none',... 'Color',color); end; xlabel('$x_1$','Interpreter','latex'); ylabel('$x_2$','Interpreter','latex'); xlim(axes1,[-5 5]); ylim(axes1,[-5 5]); box(axes1,'on'); set(axes1,'FontSize',30,'XGrid','on','YGrid','on');